The simplest attacks are often the most effective.
In most companies, webmail access portals are exposed on the internet and do not always benefit from sufficient access-control mechanisms. In addition, some messaging services offer extended features that go beyond simple email consultation, such as file sharing or access to collaborative applications.
Poorly secured messaging services therefore represent prime targets for attackers. Compromising a mailbox can then be used to launch phishing campaigns, access sensitive data, carry out fraud attempts, or even gain access to other services.
At CERT-W, we regularly deal with this type of compromise. In particular, several of our investigations in 2025 involved the compromise of Zimbra email accounts, a solution used by many public and private organizations. Faced with these incidents, we noticed a clear lack of forensic documentation specific to Zimbra infrastructures.
This article is therefore our modest contribution to filling this gap. We share a pragmatic approach and a few tips to help you save time when analyzing this type of environment, as well as some remediation measures.
The Zimbra Infrastructure
If you’re not familiar with Zimbra infrastructures, don’t worry: this section is for you! For the more experienced readers, feel free to jump straight to the investigation section (we won’t hold it against you).
The architecture
Zimbra isn’t just “another mail server“. It’s a complete open-source collaborative suite that brings together several useful components:
- A mail server: the core of the system.
- A calendar, contacts, and task manager: so you never forget that 9 AM meeting.
- A web client: accessible from any browser.
- Additional services: antispam, antivirus, mobile synchronization, and more.
But like any infrastructure used by hundreds (or even thousands) of users simultaneously, sizing and performance quickly become important topics. That’s why Zimbra can be deployed in two different ways:
- Monolithic mode: everything on a single server (simple and effective… up to a point).
- Distributed mode: multiple servers, each with a specific role, to better handle load, availability, and maintenance.
In simplified form, a distributed Zimbra infrastructure looks like this:
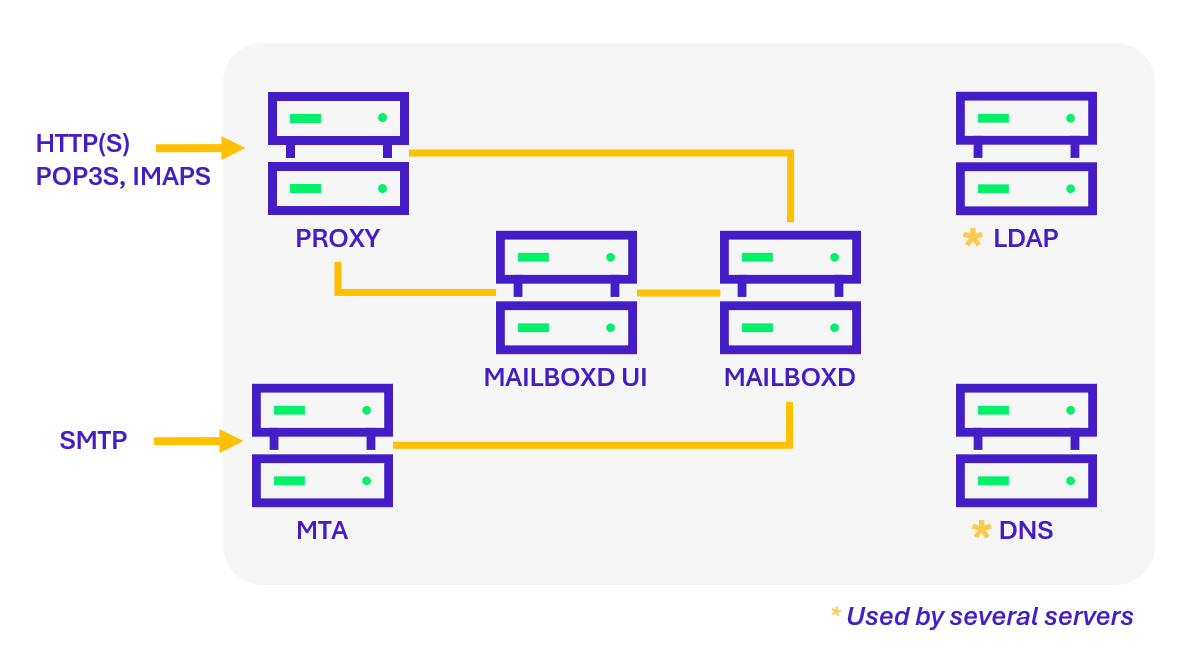
Although the architecture may vary, the following components are usually present:
- Proxy Server: the entry point for Web, IMAP/POP, and ActiveSync clients. Logs generated at this level provide visibility into user connections (IP addresses, user agents, timestamps, etc.).
- Web Client Server (Mailboxd UI): hosts the Webmail interface used by users to access their mailbox through a browser.
- Mailbox Server (Mailboxd): hosts user mailboxes and manages messages, folders, and calendars. This component generates the richest logs (e.g., mailbox.log, audit.log, sync.log).
- MTA Server (Message Transfer Agent): receives emails via SMTP and delivers them to the appropriate Zimbra mailbox server using the LMTP (Local Mail Transfer Protocol).
The Zimbra MTA relies on several complementary services:
- Postfix MTA: handles message routing, relaying, and filtering (including attachments).
- ClamAV: antivirus engine responsible for scanning messages and attachments.
- SpamAssassin and DSPAM: spam filters that use various mechanisms to identify unwanted emails.
- Amavis: the orchestrator that runs the configured antivirus and antispam engines, then applies processing policies to incoming messages.
The MTA server plays a key role in the Zimbra infrastructure. This is where most of the security checks applied to incoming emails are performed. The diagram below illustrates the main stages of this analysis workflow:
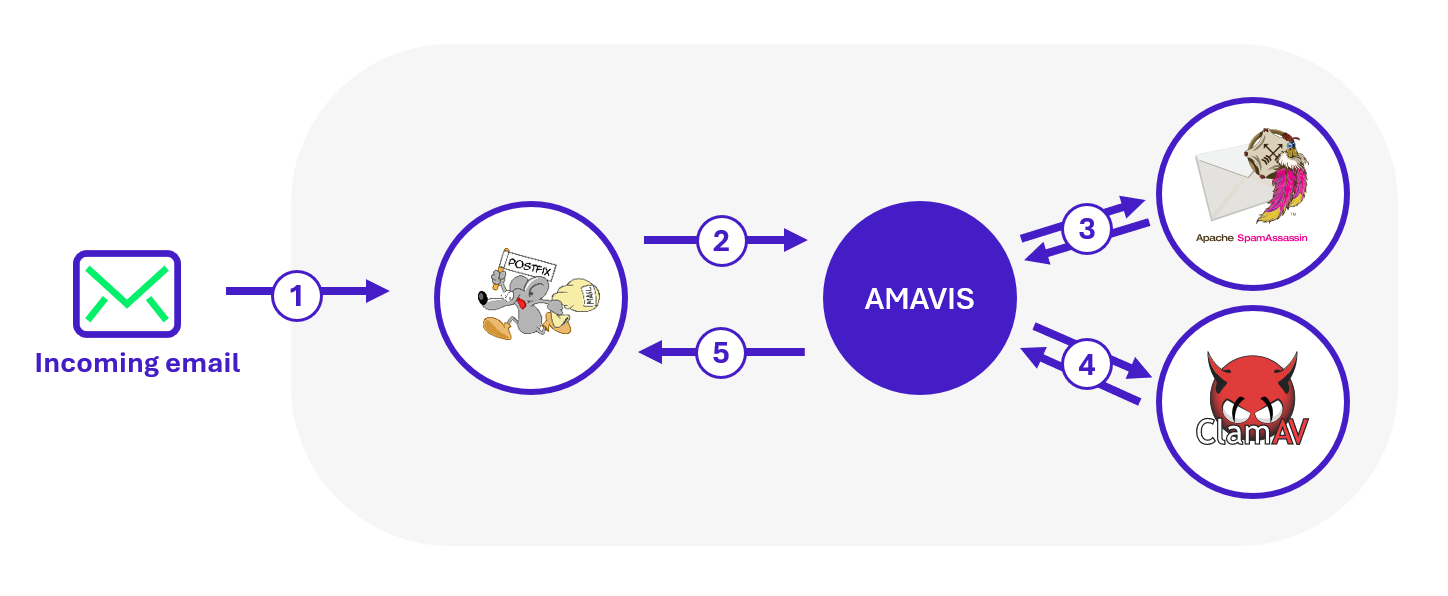
In the process of receiving an incoming email, the message is first handled by Postfix, which then forwards it to Amavis for analysis. Amavis invokes the various configured analysis engines and submits the email to each of them to collect their results. Based on the defined policies, Amavis returns a verdict to Postfix: deliver the message, block it, or move it to a specific folder.
Zimbra logs
Now that you’re practically a Zimbra architecture expert (or almost 😉), you’ve probably noticed that many services are required to handle users’ email sending and receiving. The good news is that each of these services generates its own logs, providing significant visibility into the activity of the mail infrastructure. And for us forensic analysts, that’s excellent news: we love logs!
Studying the logs generated by Zimbra allows us to reconstruct the timeline of a compromise, identify compromised mailboxes, spot malicious attachments, and even detect potential internal relays.
This wealth of information is made possible thanks to logs, which are mainly located in:
- /opt/zimbra/log/mailbox.log: main log of user activities (authentications, sending/receiving emails, managing mails, folders, contacts, calendars, etc.).
- /opt/zimbra/log/access_log: Webmail access log (IP addresses, user agents, visited URLs).
- /opt/zimbra/log/audit.log: authentication traces (successes, failures, mechanisms used).
- /opt/zimbra/log/sync.log: mobile synchronization traces (ActiveSync/EAS).
- /opt/zimbra/log/convertd.log: file conversion traces (Webmail previews, indexing).
- /opt/zimbra/log/clamd.log | /opt/zimbra/log/freshclam.log: ClamAV antivirus activity.
- /opt/zimbra/log/spamtrain.log: traces of user-initiated antispam training.
- /opt/zimbra/log/cbpolicyd.log: Postfix policy enforcement (quotas, anti-relay, restrictions).
- /var/log/mail.log: system Postfix logs (SMTP, LMTP, Amavis).
- /var/log/nginx.access.log | /var/log/nginx.log: Nginx web server logs (useful for contextualizing web sessions).
Unfortunately, in a distributed Zimbra architecture, logs are not centralized. In other words, to get a complete picture of an incident, an analyst often needs to collect logs from each node: proxy, mailstore, MTA, or any other peripheral server. Yes, it requires a bit of gymnastics (and patience).
As we mentioned, the wealth of Zimbra logs is a real goldmine for investigations… but, like any mine, you need to dig methodically, or you’ll quickly find yourself buried under tons of log lines. Some effort in sorting and correlating data is therefore necessary to extract relevant information.
And despite their undeniable usefulness, Zimbra logs have some notable limitations:
- No access to the full content of emails or their attachments.
- Email subjects are rarely available, except when intercepted by antispam or antivirus modules.
- No native visibility into the creation of forwarding rules.
- Rapid rotation of verbose logs (like log), which limits the analysis time window if logs are not centralized.
Investigating in a Zimbra Environment
Now that Zimbra’s infrastructure and logs hold no secrets for you, it’s time to get practical.
Imagine you’re a forensic analyst, arriving early one morning, when suddenly: the phone rings. You’re being called because several users are reporting that emails, they didn’t send are appearing in their “Sent” folder.
Panic ensues! Users are afraid to log into their mailboxes, and some administrators start wondering whether the Zimbra infrastructure itself might be compromised.
Since you know Zimbra inside out, the team naturally turns to you to investigate this incident!
As a forensic analyst, many questions come to mind:
- Have the accounts really been compromised? If so, how and since when?
- How many users are affected?
- What is the attacker’s objective, and what malicious actions have been carried out from these accounts?
- Have the mail server or other Zimbra components been compromised?
- And, most importantly: do I have time for a coffee ☕️ before the information hunt begins?
To help you in your investigation, we’ll look at how to answer these questions through Zimbra log analysis. But first, here are some tips to guide your investigation.
During incident response, it’s easy to feel overwhelmed by the amount of logs and events to analyze. Keeping a clear line of reasoning is essential. A few simple practices can help maintain focus:
- Confirm: Verify the information that triggered the incident. Before diving deeper, ensure the initial alert is accurate. This undeniable baseline will serve as the foundation for the entire investigation.
- Correlate: Cross-check suspicious IP addresses and domains with other sources (proxy, VPN, EDR, online antivirus databases). This provides additional context related to the identified indicator.
- Pivot: Use the collected information to expand your analysis. An attacker might reuse the same IP address or user-agent across multiple accounts. Conversely, a compromised account might be accessed from different IP addresses or user-agents. Pivoting can reveal other indicators that help identify the attacker.
- Compare patterns: Even without direct access to email content or attachments, certain elements can reveal similarities (file size, identical filenames, repeated sequences of actions after account compromise). This behavioral analysis approach can help identify multiple users compromised by the same attacker. Such hypotheses should be formulated and handled cautiously, but they can be valuable for confirming intuition.
- Ensure log preservation: This may seem obvious, but as soon as an incident is detected, securing the logs is critical. Collect logs immediately from the entire Zimbra infrastructure and extend their retention period to prevent automatic deletion. Because let’s be honest: logs disappearing just as the forensic team arrives is a way too common scenario… one you definitely want to avoid.
While these tips aren’t exhaustive, they provide a solid foundation for conducting an analysis that is both fast and efficient.
Compromise and initial access
The spoofing trap
You are not fooled! You know that sometimes one might believe the attacker is already inside the system, when in reality, they are still outside (fake it until you make it). Especially when multiple users start reporting concerning incidents, such as:
- “I received an email from so-and-so, yet they claim they never sent it.“
- “I received an email from my own address, which makes no sense!“
But your experience pushes you to verify that the current confusion is not simply the result of… a spoofing attack.
Indeed, spoofing is a relatively simple identity impersonation attack used by malicious actors to falsify email header information (e.g. sender address) in order to deceive a victim. Spoofing allows an email to be sent while pretending to be from a legitimate sender (for example, an internal user of the company or the recipient themselves), when in reality the email comes from an infrastructure that has no authorization to use that email address.
The goal is to gain the recipient’s trust to prompt them to take an action (click a link, open an attachment, provide credentials, etc.) or bypass filtering mechanisms.
Mechanisms such as SPF, DKIM, and DMARC were designed to reduce the risks associated with spoofing by allowing verification of the sender domain and server authenticity.
More specifically, the Sender Policy Framework (SPF) is an email security mechanism that allows verification that the sending server of a message is indeed authorized to send emails on behalf of the domain indicated in the sender’s address. The steps of an SPF check are illustrated below:
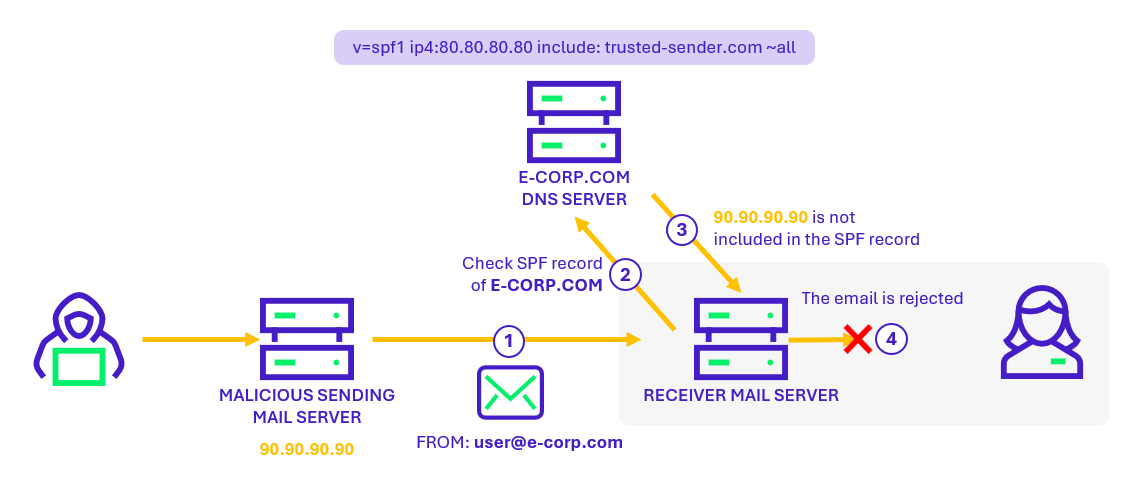
Concretely, the domain owner publishes in the DNS records a list of IP addresses authorized to send emails on behalf of their domain. When a mail server receives an email, it can compare the sender’s IP address to this list and determine whether the message is legitimate or potentially fraudulent.
An SPF check failure indicates that the email was sent from a server not authorized by the sender’s domain. This serves as an indicator for identifying potential spoofing attempts.
In Zimbra logs, SPF check failures can be identified using the following command:
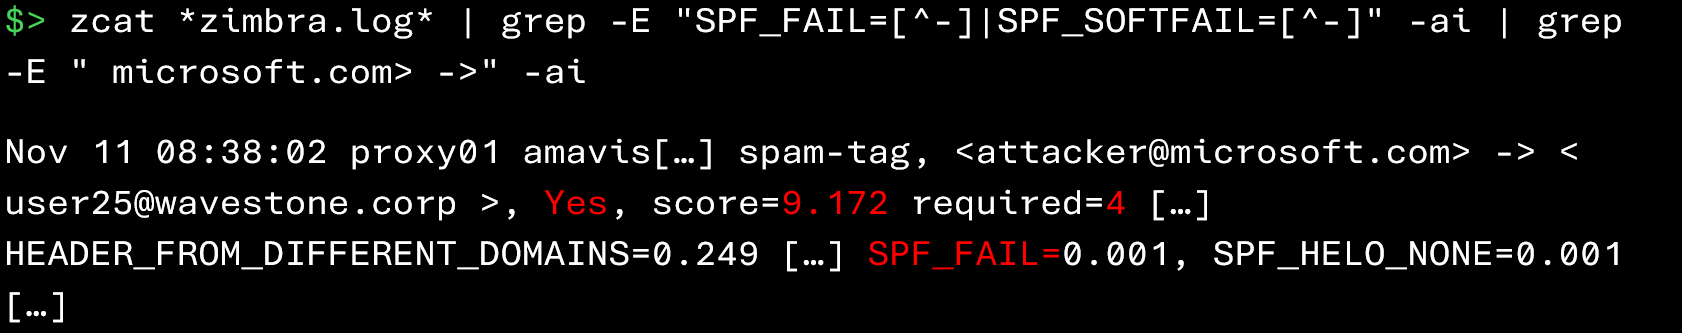
In above example, we can see that the message sent from attacker@microsoft.com to user25@wavestone.corp does not pass SPF validation (SPF_FAIL). The “Yes” field indicates that it is classified as spam. Since its score (9.172) exceeds the required threshold (4), this message will therefore not be delivered to its recipient.
However, you should not place blind trust in the antispam engine! Some emails that fail SPF checks may still be delivered. To extract only these messages, you can use the following command:
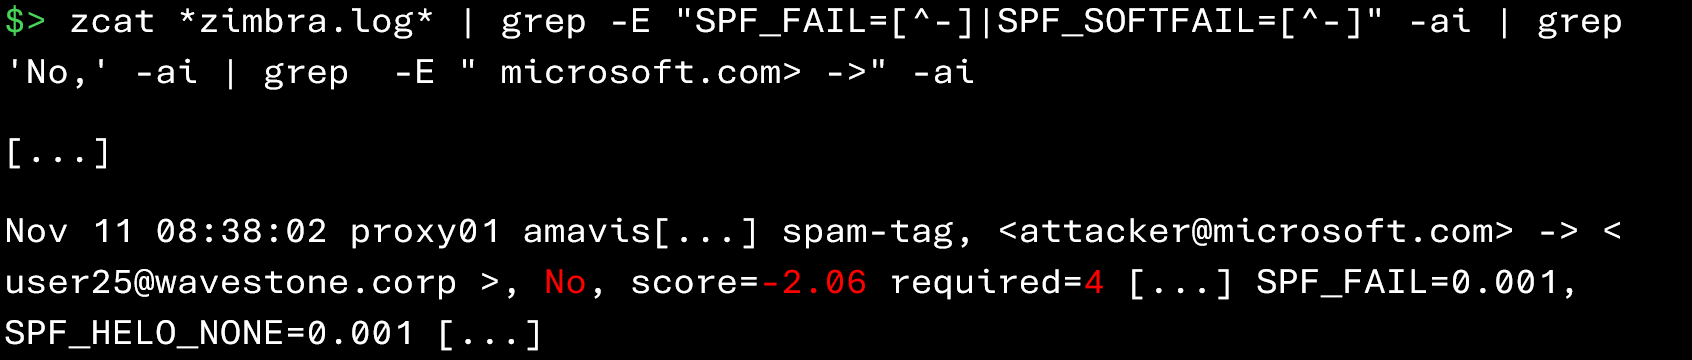
In the example below, the message fails the SPF check, but its score is negative (-2.06) and below the spam threshold (4). It is therefore considered legitimate and delivered to the recipient despite the SPF failure.
As you can see, Zimbra logs make it possible to quickly identify senders responsible for spoofing attacks. Detecting a spoofing case early in the investigation helps to quickly reduce concerns and restore a certain level of trust in the Zimbra infrastructure.
Analysis of the attacker’s initial access
Once you have confirmed that you are not dealing with a spoofing attack, it means the attacker has, in one way or another, succeeded in compromising an account or a component of the infrastructure. The first step of your investigation will be to identify the attacker’s initial point of entry. This means finding the answers to the questions “Where?”, “When?”, and “How?”. But when it comes to compromising a mailbox, several approaches are possible…
Account compromise through password brute‑forcing
One path you can explore is the possibility that the attacker attempted to compromise certain accounts through a brute‑force attack.
To do this, simply examine authentication failures in the Zimbra logs:
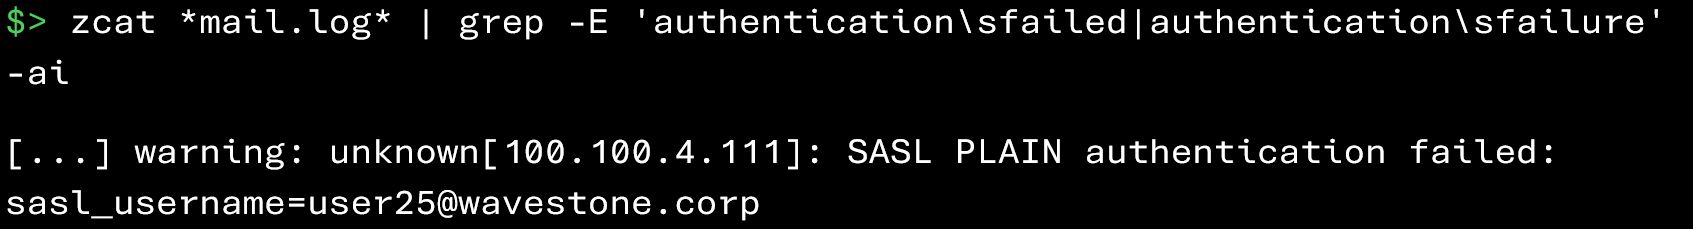
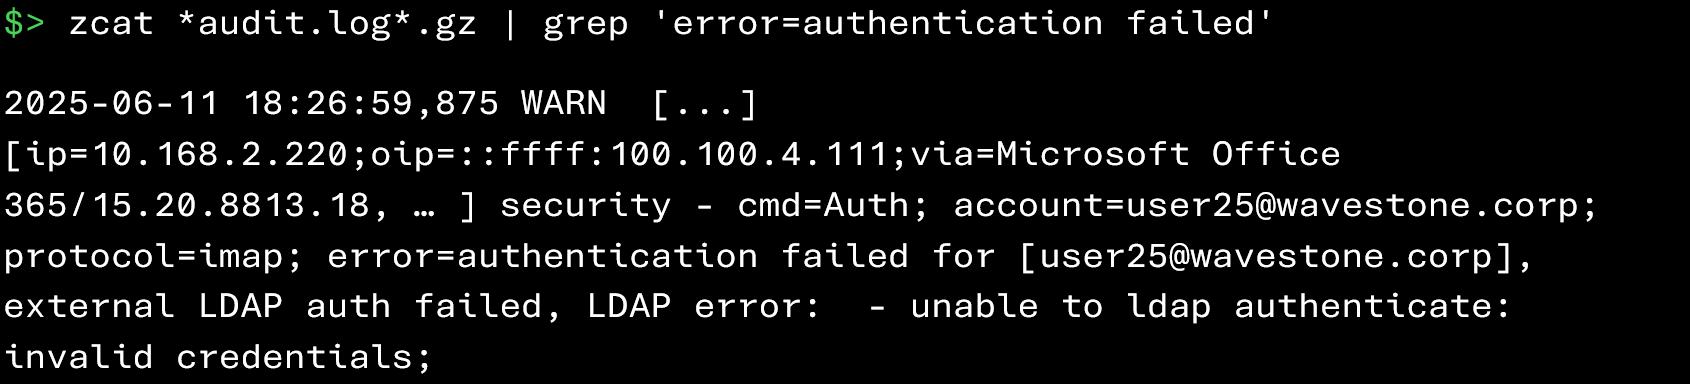
In the events above, we can see authentication attempts coming from the IP address 100.100.4.111 that failed for the account user25@wavestone.corp.
A large number of unsuccessful login attempts over a short period, from the same IP address or targeting the same account, is indicative of a brute‑force attempt.
An excessive number of authentication failures can also trigger automatic account lockout by Zimbra:
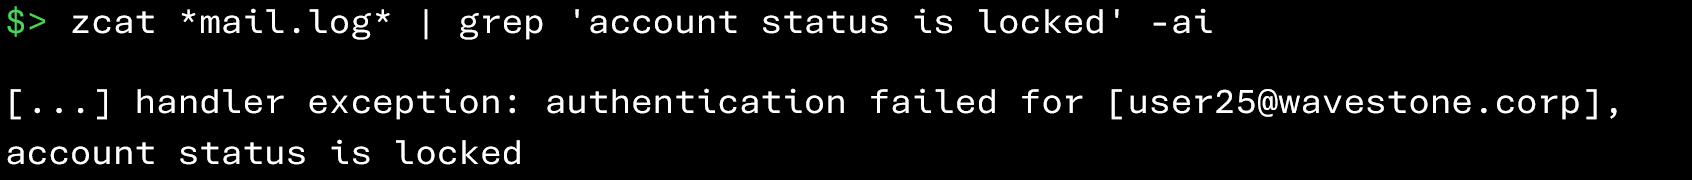
From a forensic perspective, the appearance of such an event in the logs may suggest that an account was potentially targeted.
Once the brute‑force attempt has been identified, it is possible to check when the attacker may have used the compromised account by analyzing the successful logins associated with that user:
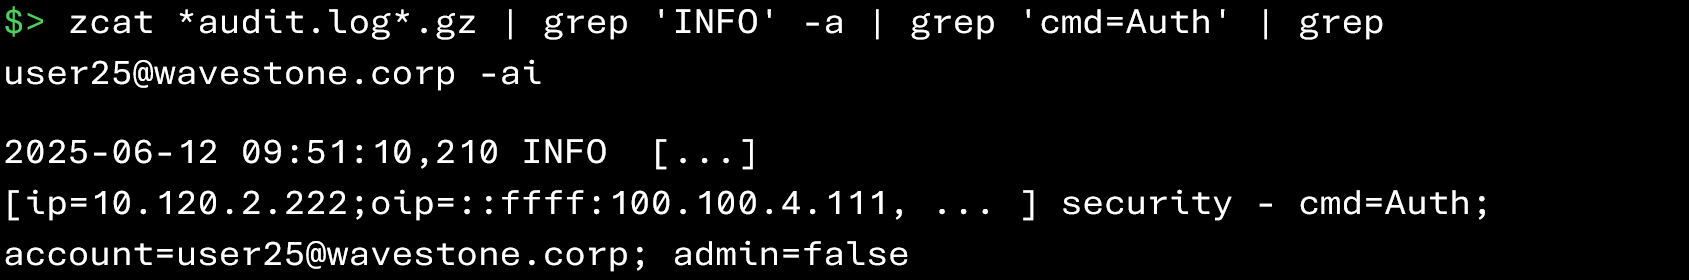
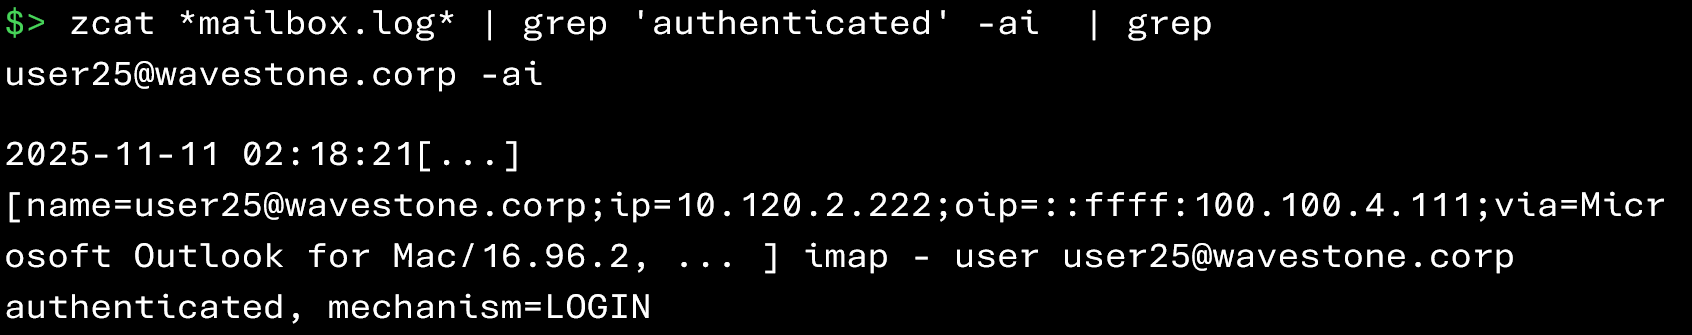
Additionally, if you have identified the attacker’s IP address, you can find all successful connections from that address using the following commands:


Once malicious connections have been identified, it is necessary to analyze the account activity following these accesses in order to identify the actions performed by the attacker.
Account compromise through phishing attacks
If no brute‑force attempts have been identified, another common initial compromise vector is the way too familiar: phishing attack! In this case, the attack does not target the Zimbra infrastructure directly: the user first receives an email prompting them to visit a fraudulent page or open a malicious file. Only after clicking does the damage occur (such as credential or session token theft).
In this scenario, you should, if possible, retrieve the malicious email from the user’s mailbox for analysis. If you can obtain it, here are the key pieces of information to collect:
- Date and time of receipt
- Subject of the email
- Sender (From)
- Recipients (To, Cc)
- Reply addresses (Reply-To, Return-Path)
- IP address of the originating sending server
- Names of attachments (if any)
- Results of SPF, DKIM, and DMARC checks
- Identified phishing URLs (if present)
These elements will help reconstruct the attacker’s methodology, provide initial guidance for your investigation and define first remediation measures.
Unfortunately, if you do not have direct access to the user’s mailbox, you will need to rely primarily on Zimbra logs, specifically the events generated by Amavis when analyzing incoming emails.
Suppose you want to identify malicious attachments sent by an attacker to users. Zimbra logs are very useful in this case, as they allow you to track the files that were analyzed and extract information such as their name, size, type, and fingerprint (SHA1).
The following command allows you to identify attachments processed by Amavis during the analysis of incoming messages:
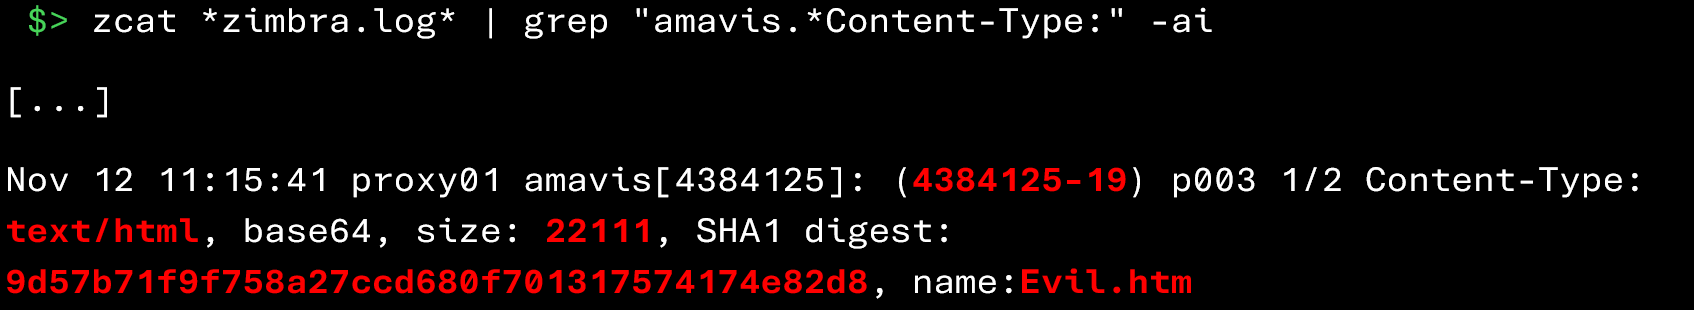
The result above shows that the file Evil.htm was analyzed by Amavis. Several useful pieces of information can be found:
- Date and time: November 12 at 11:15
- SHA‑1 signature of the file: 9d57b71f9f758a27ccd680f701317574174e82d8
- Size: 22,111 bytes
- Content-Type: text/html
- Amavis session ID associated with this analysis: 4384125-19
However, on their own, these elements do not allow you to determine which users received this attachment or who the sender was. To obtain this information, a second command must be executed to retrieve all traces associated with this Amavis session:
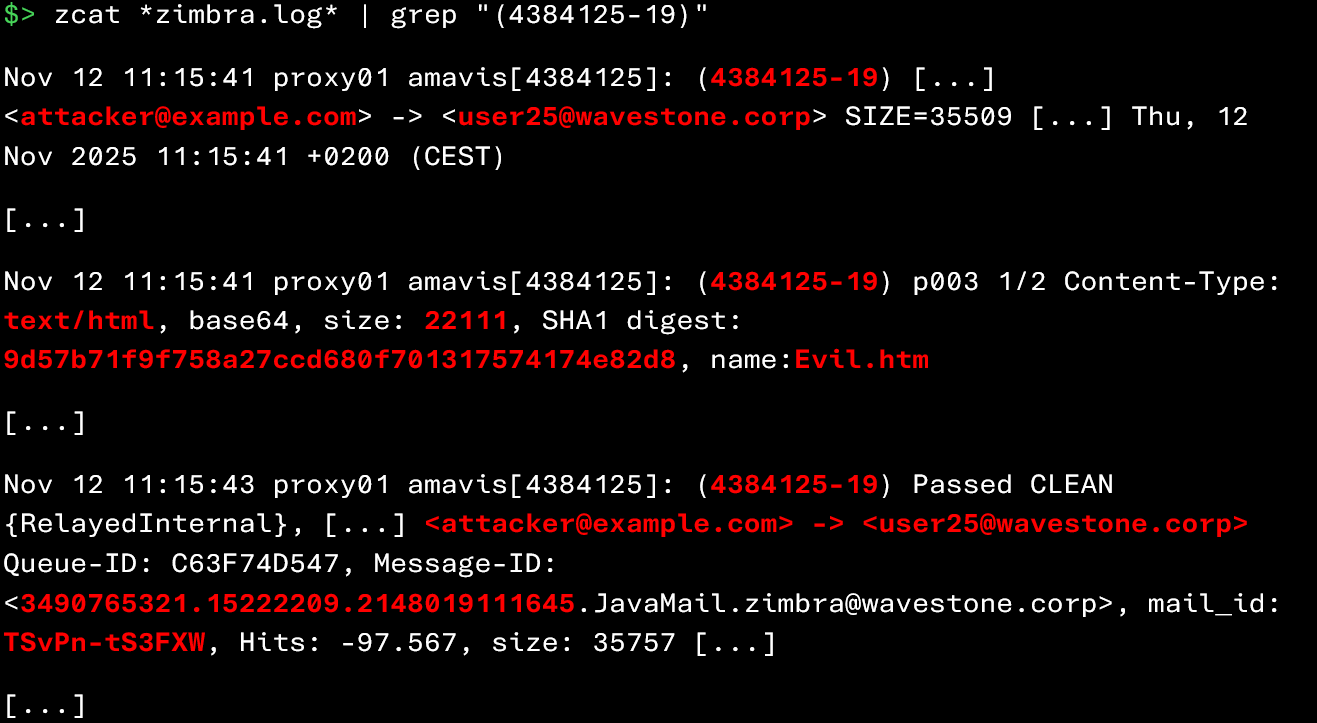
From this information, you can now deduce that attacker@example.com sent the file Evil.htm (22,111 bytes) to user25@wavestone.corp on November 12 at 11:15, and that its SHA‑1 signature is 9d57b71f9f758a27ccd680f701317574174e82d8. Not bad, right?
During your investigation, you can further filter the output of these commands to identify:
- Attachments with suspicious extensions (e.g., *.htm, *.html, *.exe, *.js, *.arj, *.iso, *.bat, .ps1, or Office/PDF documents containing macros)
- Files previously observed during the early stages of the incident (for example, a file downloaded by patient zero)
During a phishing campaign involving the delivery of a malicious file, attackers often tend to distribute the same file to multiple users. It is therefore possible to rely on statistical analysis to highlight abnormal values.
The following command allows you to identify identical files present in several incoming emails:
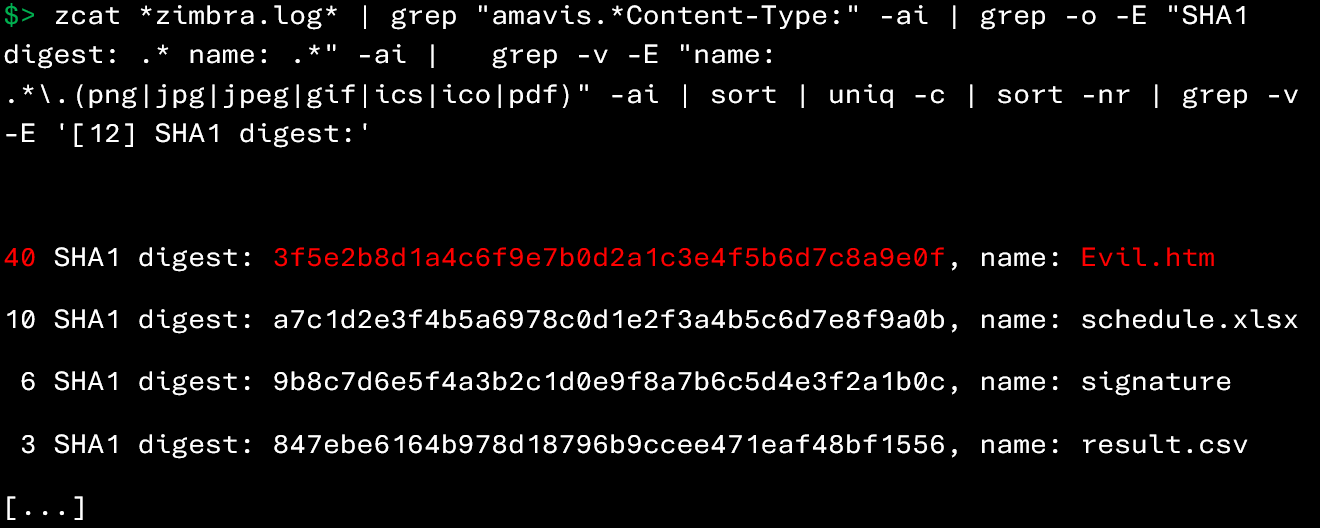
The command above allows you to retrieve, for each attachment in emails received by Zimbra, the number of times it has been observed in other emails, based on its name and SHA‑1 signature.
In this example, the file Evil.htm appears in 40 emails, which, combined with its .htm extension, makes it particularly suspicious. It would therefore be relevant to attempt to retrieve this file from the affected users to verify its legitimacy.
If the analysis of attachments did not help you identify the culprit, there is one last avenue to explore: retrieving phishing detections from SpamAssassin (an antispam engine executed by Amavis).
The following command allows you to identify messages flagged as suspected phishing by SpamAssassin:
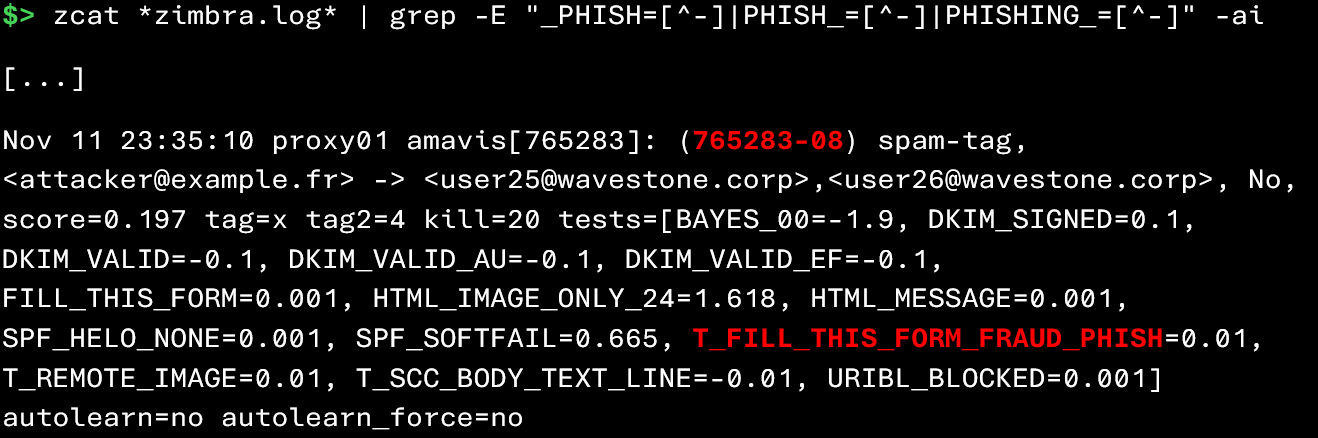
However, this command only provides limited information: the sender, the recipient, and the detection rules that were triggered. To obtain more details on the complete analysis, you must retrieve the Amavis session ID associated with the message (here 765283-08), then execute the following command:

This second command provides access to additional information generated during the analysis of the message by Amavis.
However, SpamAssassin results should be interpreted with caution, as its detection rules can generate a significant number of false positives.
Exploiting a vulnerability on the Zimbra web server
Your experience as a forensic investigator has taught you: this is neither the first nor the last time that an application vulnerability allows an attacker to hijack user sessions. Zimbra is no exception, and its web server, which provides access to mailboxes, could very well be vulnerable to this type of attack.
Compromise of the Zimbra web server could, in theory, allow an attacker to capture credentials of users logging in. “But how can we check if Zimbra has been subjected to web intrusion attempts?” you might ask.
A first step is to inspect the proxy (nginx) logs to identify malicious or suspicious HTTP requests targeting the web interface:
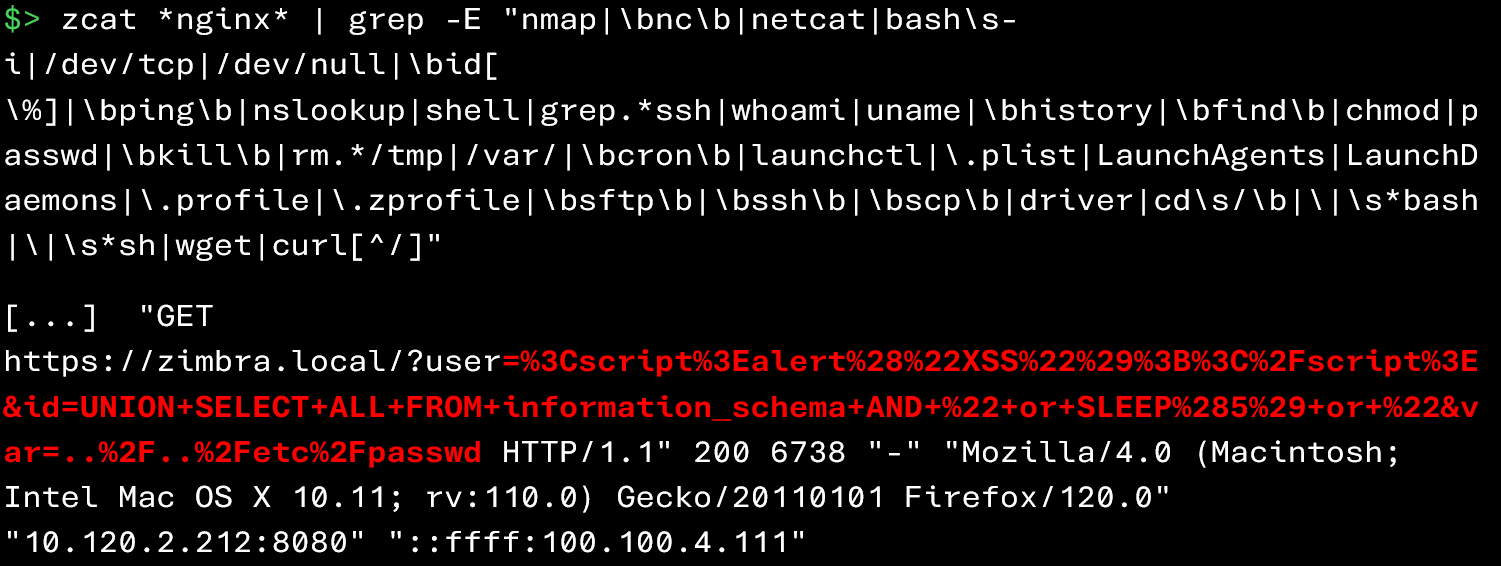
Among the indicators to look for in the logs are:
- Unusual POST or PUT requests or requests to unexpected endpoints
- Injection attempts (SQLi, LFI, RCE payloads visible in URIs or parameters)
- Repeated access to non-public resources or atypical scripts
- Strange User-Agents or a high concentration of requests from the same IP
- Numerous 4xx/5xx errors on sensitive paths (indicative of scanning/enumeration)
- Signs of file uploads (attempts to access /tmp, /uploads, etc.) or hits on known web shells
If you observe malicious requests that succeeded (for example, with an HTTP 200 code), it is recommended to conduct a more in-depth investigation on the server to determine whether the exploitation was actually successful.
Compromise of the user’s workstation
If none of the previous scenarios seem to match what you are observing and the initial point of entry remains unidentified, it is possible that the attacker obtained access credentials directly from the user’s workstation.
This type of compromise can occur, for example:
- As a result of a previous phishing campaign
- Because the user executed a malicious program on their machine (cracks, software downloaded from a dubious site, connecting an infected USB drive, etc.)
Once able to execute code on the workstation, the attacker can easily extract credentials stored in the browser, retrieve session cookies, or even install a keylogger to capture keystrokes.
Detecting this type of compromise goes beyond the scope of this article. But keep this possibility in mind: if no intrusion traces appear in Zimbra, the problem may lie elsewhere 😉.
Yes! The investigation is far from over! This first part has allowed you to master Zimbra’s architecture, understand the different sources of evidence, and observe that through Zimbra logs it is possible to identify several compromise techniques. However, the initial access is only the starting point of our research. In a second part, we will continue the post–initial-access analysis. First, we will try to identify the malicious actions carried out by the attacker after compromising an account. Second, we will review the various remediation measures to implement. Stay tuned, a follow-up article will be published soon to delve deeper into these next steps!
Sources
- https://wiki.zimbra.com/wiki/Log_Files
- https://wiki.zimbra.com/wiki/Troubleshooting_Course_Content_Rough_Drafts-Zimbra_Architecture_Component_Overview
- https://wiki.zimbra.com/wiki/Trouble_Shooting_Spam_Score_Changes