If we have seen in a previous article the predominance of FAIR in the world of quantification[1], another article published here in early June[2] (detailing the FAIR method in its second part) emphasizes the care to be taken in the method workflow, whose results of the calculations (possibly being automated) allow to obtain precise values. .
However, how to model these different FAIR input data? How to compute with these data? Are there tools to simplify their collection or estimate their quality, and what efforts do they require to be implemented?
Having seen previously how trustworthy the risk quantification method was in its processes, let’s now see how the inevitable part of subjectivity can be isolated, and which facilitators can help to obtain reliable results.
The FAIR fuel: data
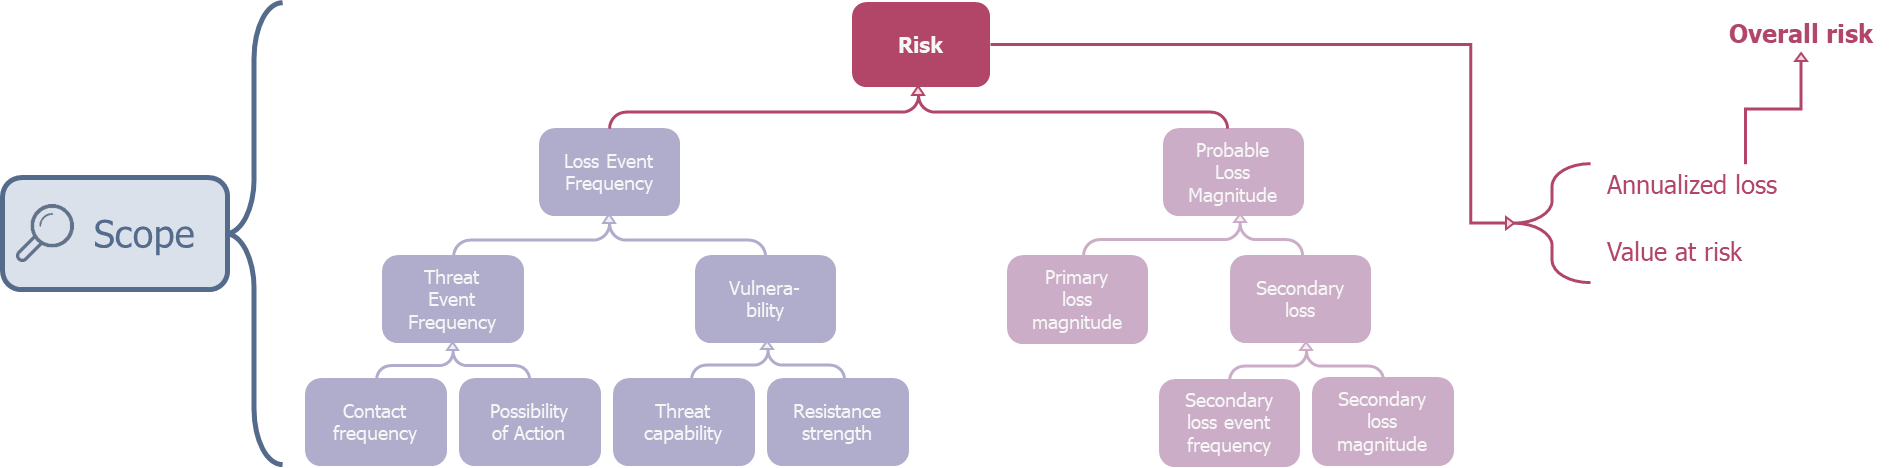
The risk analysis proposed by FAIR (according to the standardization document published by openGroup)[3] is carried out in four stages:
- At first, in a fairly conventional way, it is a question of specifying the scope of the examined risk : what is the asset (subject to risk), what is the threat context (agent and scenario), and what is the loss event (the dreaded event in terms of losses);
- The second step (called Evaluate Loss Event Frequency) aims at collecting all the frequency data related to the loss event (and thus intimately linked to the threat agent). This consists of collecting the values for the left branch of the arborescence below.
- The third one (called Evaluate Loss Magnitude), because it assesses the loss, is focused on the asset. It is then a question of estimating the various primary losses (i.e. the inevitable loss in case of risk occurrence) and secondary (or possible loss, i.e. not occurring systematically when the risk advent). Its goal is to collect the values of the right branch in the tree below.
- Finally, the last step (called Derive and Articulate Risk) consists in merging the collected data as defined in the FAIR tree by the various calculations, to obtain the result in the form of usable outputs.
Link between FAIR analysis and taxonomy
Without detailing more the taxonomy, already discussed in the article presented before2, one can note that the standard analysis of a single risk requires seven data (corresponding to the elements at the base of the tree):
- Contact frequency;
- Possibility of action;
- Threat capability;
- Resistance strength;
- Primary loss magnitude;
- Secondary loss magnitude;
- Secondary loss event frequency.
It should be added that FAIR invites to decline losses (primary and secondary) into six categories (in order to ease and accurate estimate of the loss):
- The production losses: related to the interruption of the service produced by the asset;
- The response cost: related to the incident response;
- The replacement costs: related to the replacement of damaged constituents of the asset;
- The fine/judgement costs: related to fines, court fees and legal proceedings;
- The financial impact on competitive advantage: related to the impact on the organization in its sector;
- The reputation costs: related to the impact on the public image of the organization.
How do we correctly model risk uncertainty?
Furthermore, it is good to ask the question of what a FAIR data is actually.
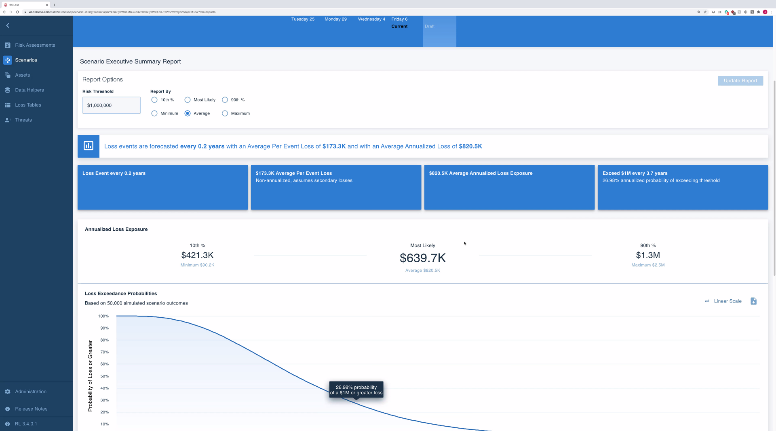
Indeed, it is too reductive to define a data by a single numerical value. For example, lets consider a ransomware attack: it would be incorrect to say that an occurrence of this risk would cost exactly 475k €[4] (illustrated by the blue curve on graph 1).

Graph 1: A distribution, a more realistic model than a single value
However, adding uncertainty to this data by accompanying it with a minimum value (which could be 1€ in our example) and a maximum one (of 300 M€ in the same example), while keeping the most likely value stated above, would allow to model much more accurately the reality (purple curve of graph 1).
A data is then defined by a minimum, a maximum and a most likely value (corresponding to the peak of the distribution). We can also, note that such a probability distribution is independent of the kind of values considered: it may as well be a loss in any currency (cf. the previous example), than an occurrence (for example, between once a year and once every 10 years, and a value more likely around once every two years), or even a ratio (between 30% and 70%, more likely 45%). Hence, we can use these distributions to model all the data of the FAIR taxonomy.
Another advantage of predicting uncertainty through distribution is that it is possible to fine-tune the degree of confidence in the most likely value, via the kurtosis coefficient of the curve. The higher it would be, the greater the data will be trusted (corresponding to a very marked peak, see the green curve on graph 2). On the other hand, an unreliable data will be modelled by a much more homogeneous distribution (see the red curve on graph 2).

Graph 2: Reflecting the level of trust through distributions
However, using distributions rather than fixed values is a problem when it comes to combine them, which will necessarily be the case when we will make the computations of the FAIR tree. As we can indeed see on graph 3 (the addition of the green distribution and the red one giving the violet), the addition of two distribution does not allow to obtain a distribution as ‘simple’ as the previous ones (it no longer follows a log-normal distribution). This is also the case in the context of a multiplication (the result of which is also complex).

Graph 3: addition of two distributions.
To obtain a mathematically consistent result, game theory gives us a simple way: The Monte Carlo simulations. It is in fact a matter of dissecting the distributions (the green and the red of the graph 3), in a predefined number of random values (called number of simulations), distributed in such a way as to correspond to the given distribution. We can then combine the distributions thus dissected by performing the calculations on pairs of values of each distribution. The new distribution can then be approximated, and will be all the more precise as the number of simulations will be large.
Hands on toolboxes to automate FAIR…
To make these calculations and obtain a numerical value of risk, solutions have emerged (mainly from the FAIR method). We will therefore address here the pros and cons of these tools, which are also cited in the previous article1.
The OpenFAIR Analysis Tool
The first we can cite hire is the OpenFAIR Analysis Tool[5]. While this tool has a pedagogical purpose, it nevertheless helps to understand how FAIR works. It is thus possible to have a first concrete application of the method, and to obtain simply results (only for the analysis of a single risk). Developed by the University of San José (California) in collaboration with the OpenGroup, this tool relies on an Excel sheet to obtain a risk assessment from a predetermined number of simulations, scrupulously respecting the FAIR taxonomy.
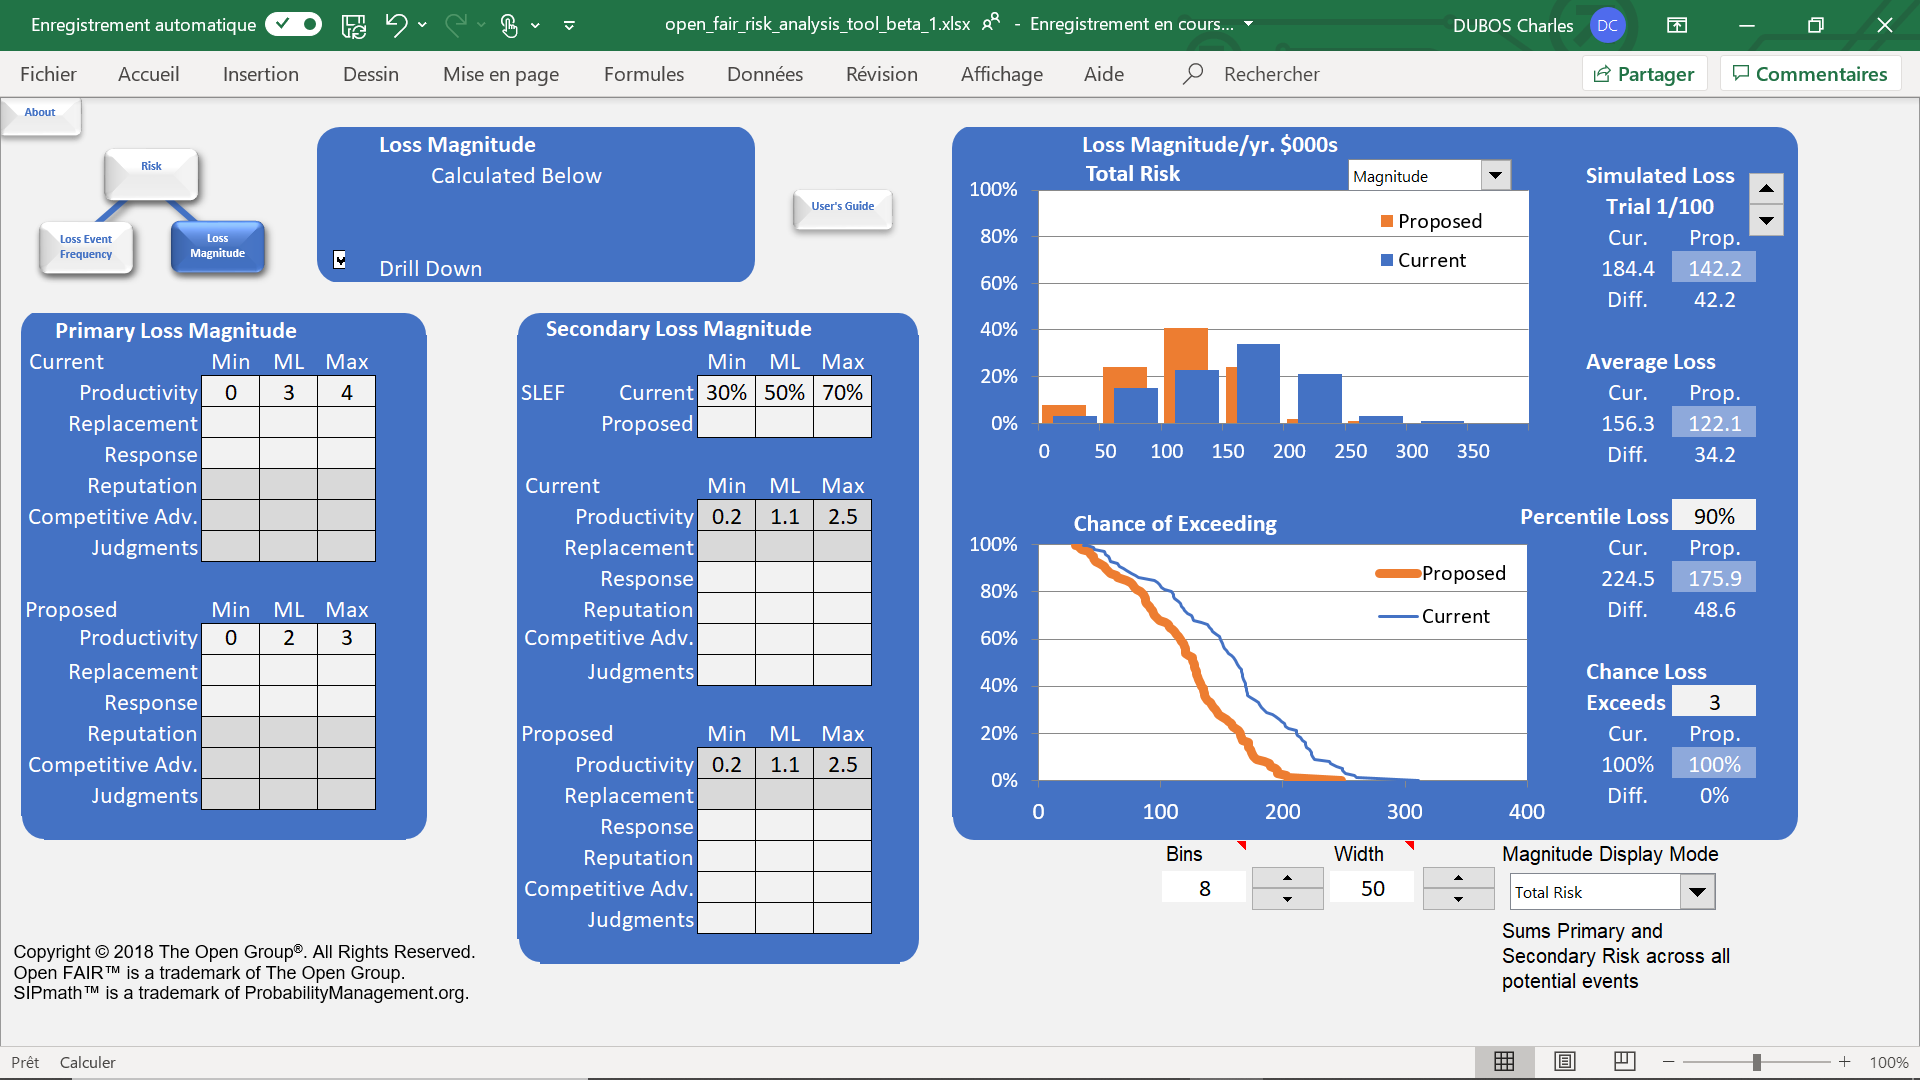
OpenFAIR Risk Analysis Tool: a tool that is first and foremost educational
Very useful to have a first contact with quantification, this tool remains however very limited in terms of use. Finally, one should note that Excel is needed, and it is only accessible with an evaluation license limited to 90 day.
Riskquant
For a larger scale use, Netflix’s R&D department has developed Riskquant[6] solution. It is a Python programming library, relying more particularly on tensorflow (a specialized python module for massive statistical calculation). Riskquant’s particularity is to propose a quantification of risk inspired by the FAIR taxonomy, but with a great freedom in its approach and its implementation. Developed to facilitate the use on containers, it would allow by its design very fast evaluations from csv files.
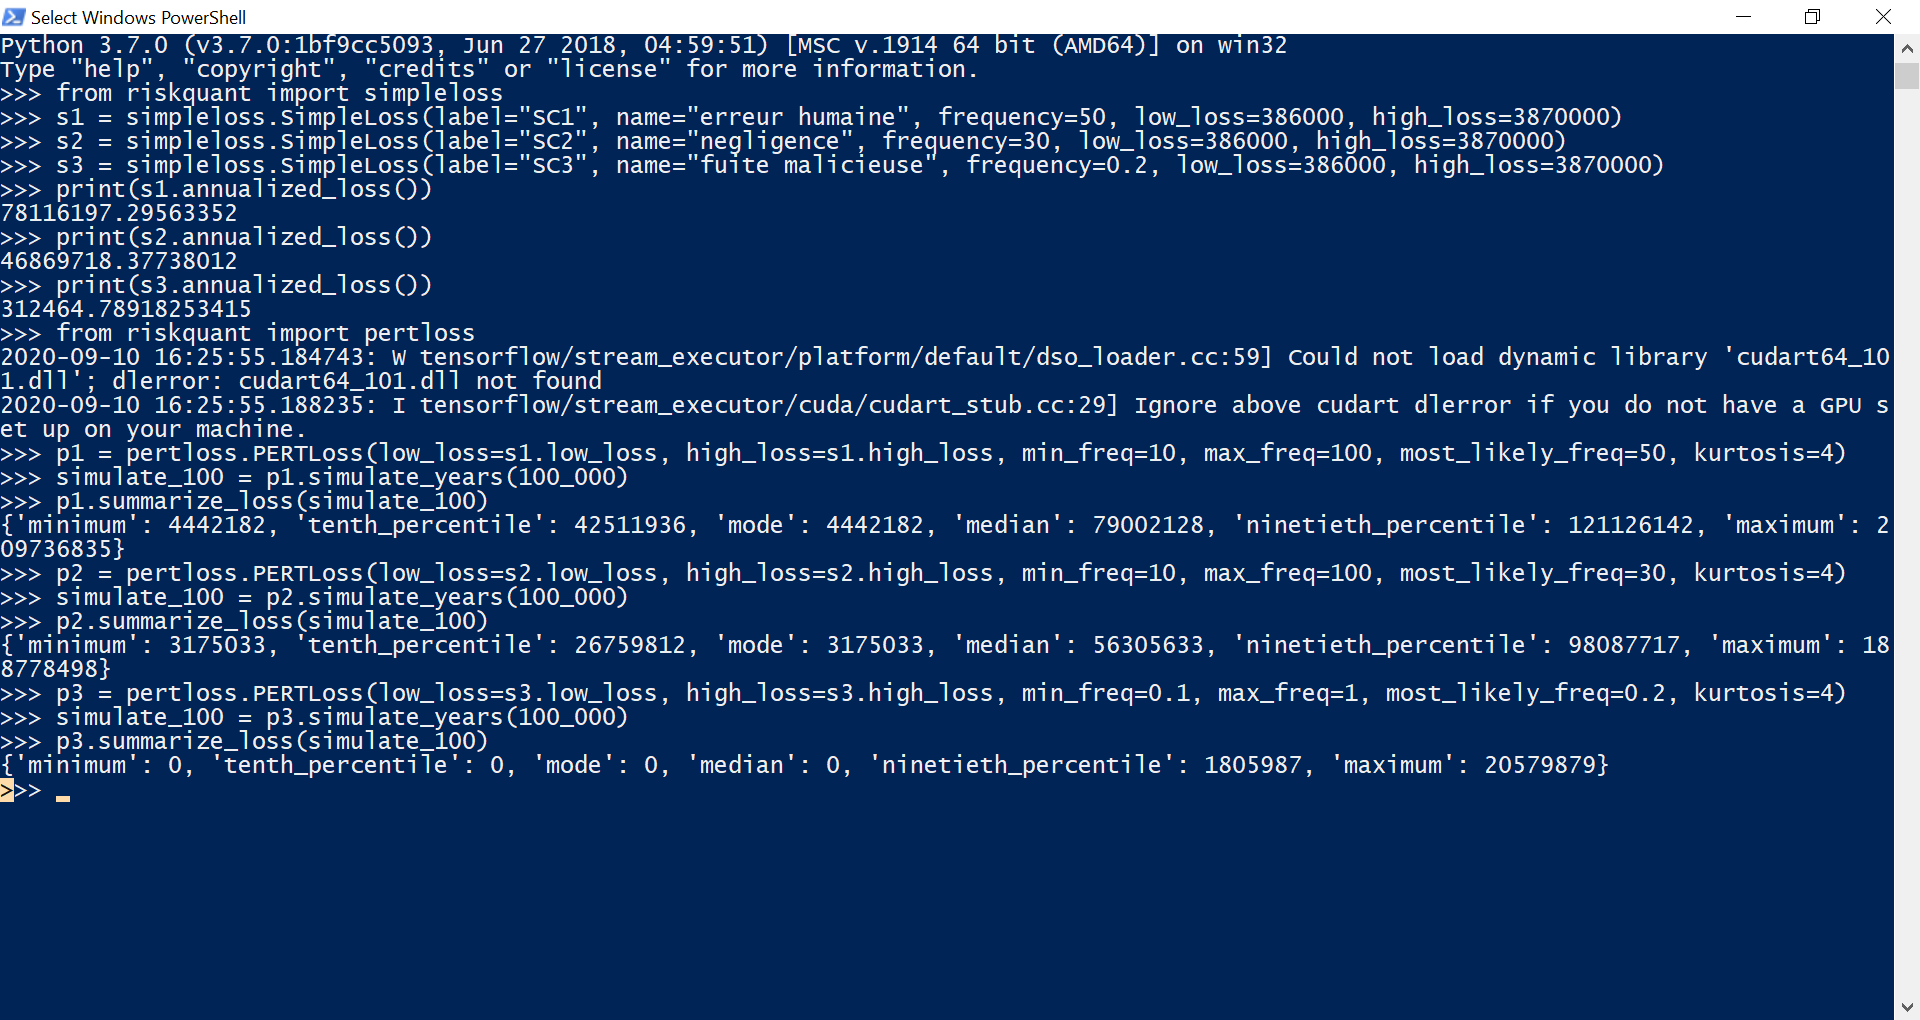
Riskquant: an original approach but lacking maturity
However, keeping of FAIR taxonomy only a single loss value and a single frequency makes it not very usable, especially in the context of an organization that would seek to precisely scope its risks. In addition, it provides so far only a few exploitable results and clearly lacks maturity. Finally, it seems to have been dormant since May 1st, 2020 (the date of the last commit on the GitHub page of the solution).
PyFAIR
To conclude on this paragraph on solutions that can be used for a basic implementation of FAIR, the PyFAIR library is available on the official python repository (downloadable via the pip tool). Now mature, the tool allows a decomposition of risk according to the FAIR taxonomy. It also allows the feed of the FAIR tree with intermediates values, or the aggregation of data that can be used for several risks (e.g. allowing groupings by asset or threats). It is capable of calculating overall and global risks, and provides easily usable distributions (exploitable with other simple python modules), but also gives access to advanced charts and HTML pre-formatted reports.
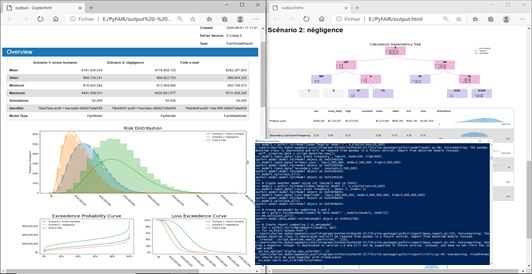
PyFAIR, a complete and efficient library in Python
Although it remains a programming toolbox, hence requiring an appetence and time to develop and maintain a Python solution, PyFAIR is well-designed. It facilitates the implementation of FAIR by staying very close to the taxonomy, and provides functions facilitating implementation and the exploitation of the results. Suitable to be operated on multiple levels (i.e. using it only to calculate results by influencing the fine settings of FAIR and Monte Carlo, or by exploiting its high-level reporting functions), it makes it possible to envisage a use of quantification technically facilitated and on a large scale.
‘Turnkey’ platforms to make data acquisition easier:
Nevertheless, the main difficulty of FAIR remains, as we have seen before, obtaining the data and their trust level. To deal effectively, the most efficient solution is to rely on a platform that integrates a CTI database.
These platforms provide risk threat statistics (very few company-dependent). They also support in deploying and implementing the quantification method in the organization, which includes a guidance in obtaining the appropriate loss data.
RiskLens
The first of these solutions is the RiskLens[7] platform. This solution, directly derived from the FAIR methodology, was co-founded by Jack Jones. It is used as technical support for the development of the method, linked to the FAIR Institute. Emphasing on a technical approach of the method, it focuses on the respect of the standards of analysis in general and the definition of the perimeter (first step of FAIR) in particular.
RiskLens, FAIR’s application to the letter
Nevertheless, it should be noted that, on the one hand, this solution requires advanced notions in the FAIR methodology to be easily operable. Indeed, the platform does not provide a consequent help in obtaining data (which, as we have seen, remains the keystone of quantification), on the basis that the definition of the perimeter is enough to define precisely the data, and thus to obtain it easily. On the other hand, it is an American platform, which implies that the interface (quite unintuitive) is only available in that language, and that the data collected is also subject to U.S. regulations.
CITALID
The second platform we will mention here is the French startup CITALID, whose approach is fundamentally different. Indeed, it has been founded by two ANSSI analysts, who wanted to link the CTI to the risk management. Thus, using FAIR as the tool to make this link, it makes its effort on the conception and the maintenance of the database, made of solid figures kept up to date, to closely monitor the local and international cyber geopolitical situation.
CITALID, a high value-added database
The CITALID platform provides real support in the definition and the collection of the FAIR data, thus allowing to identify precisely where is the remaining part of subjectivity undeniably linked to risk. Available in French and English, it facilitates the management of cyber risk by taking into account all the parameters of the organization (location, size, sector of industry, level of maturity, compliance with standards, etc.), to provide data originating from appropriate contexts. Furthermore, and in addition to an interactive explanation of each of the platform’s fields, the startup supports its customers in collecting the needed inner data of their organization.
First step with FAIR…
Anyhow, the difficulty will always be to succeed in the transition from qualitative to quantitative estimation. Even if solutions can facilitate this shift, leaving a controlled qualitative method for a new unassimilated assessment method remains a challenge, despite all the benefits the new method promises.
If three points were to be highlighted to pursue on the quantitative way, they could be:
- First, to make sure the required maturity is reached. Quantification requires a good understanding of the level of security of the concerned IS, and a pre-existing and well-established risk management method. If quantification provides solutions to assess the cost of a risk, provision it or estimate the ROI of a measure, it is however useless (or even counterproductive) to embark on this path too early (at best it will be a waste of time, at worst it will degrade the existing risk management process).
- Then, to have a gradual approach in the deployment of quantification. In a mature IS with stable risk management, it is preferable to gradually adopt the quantitative method. This allows to gain confidence in the estimates produced (potentially by making it coexist with the elder qualitative estimation method) and to assimilate the methodology, while ensuring its integration into the existing risk management workflow.
- Finally, rely on existing experience in collecting cyber risk data. As the difficulty stays confined in obtaining reliable data, it is crucial (to be confident in the method) to have trusted figures. It then seems appropriate make use of a platform that can provide data of quality, and a support in the collection of our own data. It will furthermore have more experience deploying the methodology to various customers. The quality of the provided results will then be the key element in the confidence that the organization will have in the quantitative method.
[1] https://www.riskinsight-wavestone.com/en/2020/11/quantified-risk-assessment-1-2-a-quantification-odyssey/
[2] https://www.riskinsight-wavestone.com/2020/06/la-quantification-du-risque-cybersecurite/
[3] https://publications.opengroup.org/c13g
[4] https://www.sophos.com/fr-fr/medialibrary/Gated-Assets/white-papers/sophos-the-state-of-ransomware-2020-wp.pdf
[5] https://blog.opengroup.org/2018/03/29/introducing-the-open-group-open-fair-risk-analysis-tool/
[6] https://netflixtechblog.com/open-sourcing-riskquant-a-library-for-quantifying-risk-6720cc1e4968