Dashboards are an essential tool for CISOs to measure and control risks in their scope, to steer their projects and to inform their management of the company’s cyber health evolution. However, according to Wavestone’s Cyber benchmark results from 2022, 47% of companies have insufficient indicators or dashboards. In practice, indicators provide only a simple overview on a perimeter, and offer limited insights on the achievement of the company’s strategic and operational goals. If the deviations are not correctly measured, it will be complicated to deploy relevant measures of improvement, necessary to define operational priorities as well as to gather more resources in areas that are the most at risk.
Furthermore, it would be riskier to entrust on one’s dashboards without having the reassurance offered by the indicators’ relevance and reliability. This can lead to serious loss, or even to some major incidents. The crash of the Eastern Airlines 401 in 1972 is a striking example: a simple burnt-out light bulb, that was used to indicate the correct deployment of the landing gear, mobilized the entire crew, who were unable to notice in time the alarm that indicated the plane’s drastic decrease in altitude. The plane crashed a few minutes later.
How to reconsider your indicator’s base to make your dashboards more efficient and reliable?
What are dashboards, KRI, KCI?
The dashboard is a synthetic presentation tool. Highlights the key trends used to facilitate decision making. It is a federating tool used to improve governance efficiency and is designed for everyone (not only for the CISO). Therefore, we refer to dashboards in plural. Each instance is defined by a unique perimeter, where there are specified: the recipients and their stakes, the review frequency, the associated governance, the indicators, the calculating methods used and the source, etc.
Constructing a well-defined dashboard will correctly address the business stakes of the dashboards’ users. A three-level segmentation summarizes all the requirements in an organization:
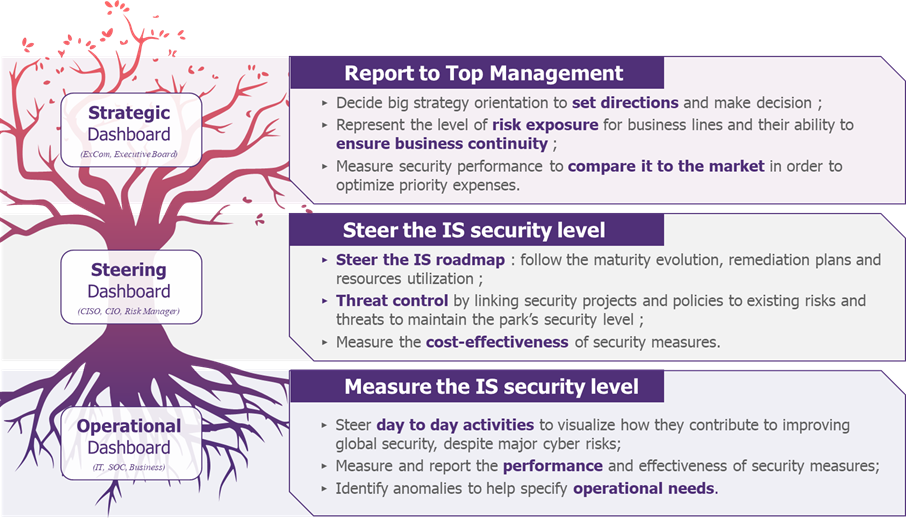
Figure 1: Typologies of cyber dashboards: uses and objectives
An indicator is a measurement that is collected, contextualized, and used to facilitate decision-making. It is implemented to answer a well-identified need by one or more departments. Depending on the purpose of the measurement, three types of indicators can be defined:
- KPI (Key Performance Indicator): measures the performance of a department, a team, or a strategic plan. They are linked to strategic objectives to measure the effectiveness (e.g., retention of cyber talent over the year).
- KRI (Key Risk Indicator): assesses an identified risk, quantifying its likelihood and/or impact at a given time. They are essential for accepting or rejecting a risk, and for controlling it over time (e.g., number of compromised business identifiers – account takeover).
- KCI (Key Compliance Indicator): measures a compliance rate in relation to a standard (PSSI, NIST, etc.). It evaluates an organization’s maturity regarding to the given standard at a specific time (e.g., % of policies updated within the last year).
How to make a dashboard efficient?
An efficient dashboard will convey self-supporting messages to the recipients. To build it, one must meticulously construct reliable and high-performance indicators, as well as minimising their number. These are defined by making a compromise between:
- their relevance (processing purpose, i.e., the ability to trigger a discussion);
- their computational cost (collection time, interpretation time);
- their maintainability over time (sustainability of data sources).
Let us take an example to evaluate the effectiveness of the “security-by-design” measures, where, in this case, a relevant indicator could be: “rate of validation of the security report at the first iteration by project scope and criticality”. First, it is operationally viable (approval process provides simple data for interpretation (binary values)). It is relevant (responding to a clearly identified issue), can be easily calculated if the processes are well set up (characteristic depending on the quality of the feedback information) and it is sustainable (the approval process guarantees reliable data over time).
A deficient indicator base can neglect one of the three criteria. This can be seen in the following field: one can often observe clusters of indicators, that are inherited by tradition without any real purpose or without responding to an outdated need; or indicators that require time-consuming gathering that creates frustration among teams. These discrepancies can be explained by a lack of long-term strategy and a lack of importance given to these indicators.
To rectify this, the existing system must be cleaned up and supplemented with performant indicators on a regular basis (methodology detailed in section 3.1) where the management of indicators itself is just as important as the other issues. Therefore, it must be monitored by a dedicated sponsor within the CISO’s governance team and by dedicated monitoring indicators (% of indicators defined with an approved calculation method, % of indicators that are fully automated, etc.). This central governance helps in finding compromises and minimising the number of indicators: about ten per perimeter/program is an order of magnitude that works well.
Increase team engagement to get more useable data?
It is not new: getting people to accept change and integrate new tools is always a tricky subject, especially for CISOs. The complexity of the environment, lack of dialogue between cyber teams and business lines, unsuitable tools, useless or unanalysed collected data, etc., represents numerous reasons that can explain a team’s lack of commitment. To address this, there are two principal areas to focus on:
- Engage your employees in the indicator’s life cycle;
- Facilitating the report of indicators with automation to minimize the workload.
Engage employees throughout the indicator’s life cycle
Team’s organizational complexity and local engagement are the first challenges that need to be addressed before deploying a dashboard: information gathering requires a dialogue between lines of business that are not used to work together (such as finance, IT risk management, strategy, program management, etc.). Involving your operational teams on a long-term basis is vital for a more reliable gathering and reporting process of indicators. More specifically, it allows you to:
- Define more realistic indicators, unlocking operational sticking points (unavailable data, communication problems, etc.);
- Define and develop operational needs more precisely: it is necessary to arise teams’ interest in the results of the project (i.e., ensure that their work has a tangible impact for them);
- Facilitate change management to get more reliable results overall, by understanding the purpose of the gathered indicators.
It is necessary to involve the employees from the beginning of the process, as well as maintaining the dynamic throughout the indicator’s operational maintenance. Transversal workshops should be organized throughout the process below, which will help in defining the indicators or generating questions.
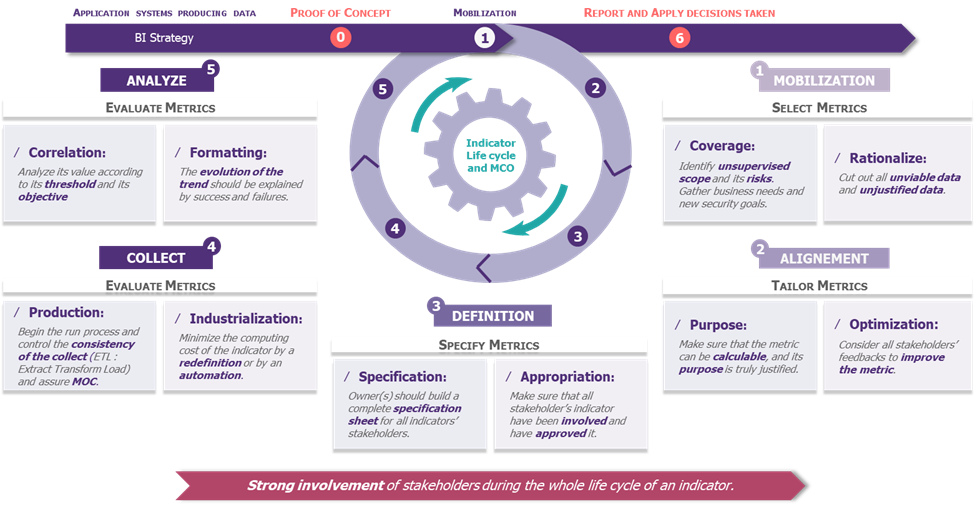
Figure 2: Indicator life cycle and maintenance
Facilitate data gathering and reporting with automation and appropriate tools
While manual collection provides flexibility to experiment and test new indicators, (semi-)automated collection increases the team productivity and provides more reliable data.
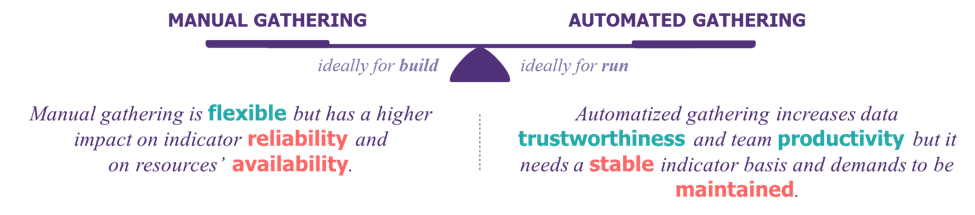
It is not always profitable to automate everything, as it depends on the data nature, data volatility or data maintenance. One of the highlighted reasons can be because of the cost of automation (it takes a full year on average to automate gathering and reporting process). Therefore, scope of automation should be carefully determined.
To scale up and automate more indicators, the corporate data culture needs to be improved. To reduce the cost of automation, it is necessary to have organized, referenced, and standardised data. Four measures to achieve that are:
- Define a corporate vision and objectives to control, reference and manage the data;
- Define policies and rules supported by top management to regulate the use and standardisation of data;
- Promote a data culture among business teams to reflect the way data is valued and used;
- Equip ISS with tools to support the organization’s data policies and strategy (Master Data Management, Data catalogue, Data lineage, etc.).
To become data-driven, the blocking points does not require to be technological, but organizational, particularly in terms of skills and ability to accept changes.
As a result, automation makes data collection “more liveable” for employees and makes the indicator’s feedback more reliable over time.
Talking to your executives: the value of limiting the number of indicators
A well-constructed dashboard is an excellent way to address and involve the Executive Committee (COMEX), even though dashboards are under-exploited for their “marketing” side. In 2022, 25% of companies have never solicited their Executive Committee, and only 30% of the market involves them regularly.
The dashboard must be self-sufficient (i.e., must be understandable at first sight), able to carry impactful messages, since it is intended to be shared with as many people as possible. The Executive Committee solves problems, accepts, or rejects risks daily, monitors budgetary performance and operational efficiency, supervises of customer satisfaction and the company’s public image. To talk to the executive committee, the dashboard must bring out the necessary essentials required to respond specifically to the targeted issues. To do so, it is more useful to highlight specific methods and solutions rather than explaining in-depth, the causes of the technical problem (unless the need is clearly expressed).
The purpose of presenting to management the “ratio of cyber FTEs over IT FTEs per entity” or the “ratio of cyber budget over IT budget” (that can be two viable approaches) is to inform and make decisions on cybersecurity resources.
In short, the choice of indicators and their format must be adapted to the COMEX. To do so, they must:
- Be focused on potential business impacts;
- Be consistent over time to have a stable indicator base and facilitate appropriation and understanding;
- Have a self-supporting form to visualize the evolution of a trend and its deviation from the set target.
Conclusion
A dashboard is only a tool that should not be considered as an end itself. However, when properly configured and defined, it is certainly the best weapon for a CISO to make cyber governance more efficient.
To set up or update a dashboard, there are 4 success factors to remember:
- Incremental: identifying sustainable indicators is difficult. Except for EXCOM dashboards, where an agile approach is necessary to integrate time for asking questions.
- Inclusive: all teams must be involved to understand the purpose of gathered indicators (and the impact on their work). This will lead to increased reliability.
- Scalable: the cyber ecosystem and its threats are growing exponentially. The designed dashboard needs to be flexible to consider the new risks that will arise (new KRI that needs to be implemented to the standard security base).
- Simple: the purpose of a dashboard is to be shared. Therefore, it must be understandable at first sight. “Keep it simple” is necessary to simplify reading and accelerate appropriation.